Lauren Novak

612.805.5718

Lauren@laurennovak.com

Weekly Market Report

For Week Ending January 14, 2023

Despite softening home prices, housing affordability continued to decline nationwide in Q4 2022 due in part to elevated interest rates. According to ATTOM’s Q4 2022 U.S. Home Affordability Report, median priced single-family homes and condos were less affordable compared to historical averages in 99% of counties nationwide, an increase from Q4 2021, when 68% of counties were less affordable. The portion of wages needed for homeownership costs also increased, with homeownership costs now requiring 32.3% of the average national wage, a 15-year high.

IN THE TWIN CITIES REGION, FOR THE WEEK ENDING JANUARY 14:

  • New Listings decreased 5.6% to 772
  • Pending Sales decreased 25.6% to 549
  • Inventory increased 21.3% to 6,111

FOR THE MONTH OF DECEMBER:

  • Median Sales Price increased 4.9% to $347,900
  • Days on Market increased 47.1% to 50
  • Percent of Original List Price Received decreased 3.2% to 96.3%
  • Months Supply of Homes For Sale increased 55.6% to 1.4

All comparisons are to 2022

Click here for the full Weekly Market Activity Report. From MAAR Market Data News.

Mortgage Rates Continue to Decrease

January 19, 2023
As inflation continues to moderate, mortgage rates declined again this week. Rates are at their lowest level since September of last year, boosting both homebuyer demand and homebuilder sentiment. Declining rates are providing a much-needed boost to the housing market, but the supply of homes remains a persistent concern.

Information provided by Freddie Mac.
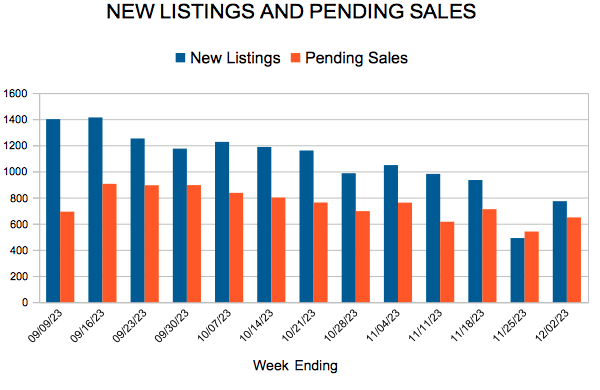
Rising rates pushed sales down for every month in 2022 compared to 2021

Higher mortgage rates and rising prices increased monthly housing costs for buyers

Minneapolis–Saint Paul, Minnesota (January 18, 2023) – The first and second half of 2022 couldn’t have looked more different, according to an annual report issued by Minneapolis Area REALTORS® and the St. Paul Area Association of REALTORS®®. After sales reached a 20-year high in 2021 while the number of homes for sale hit a 20-year low, sales in 2022 retreated to their lowest level since 2014 while housing inventory started to rise. That dynamic reflects higher mortgage rates—more than doubling from 3.25 percent to over 7.0 percent—seen in the back half of the year, and it’s rippled throughout virtually every other housing indicator. For sellers, the year still brought record sales prices despite slower increases as the year went on. But multiple offers over asking price in the first half gave way to rising market times and weaker offers in the second half.

“It felt like the housing frenzy was continuing into spring and summer, but the Fed [Federal Reserve] poured cold water on that in a hurry as inflation rose dramatically,” said Brianne Lawrence, President of the Saint Paul Area Association of REALTORS®. “In some ways that was a necessary evil, as that price and sales growth wasn’t sustainable long term. Real estate can be boom and bust like that. But over time, we’ll get back on track like we always do.”

Because 2020 and 2021 were such unique years, it’s worth comparing 2022 to a pre-COVID year. When compared to 2019, home sales in 2022 were down 10.3 percent. While market times are up compared to 2021, homes are still selling more quickly than in 2019 and 2020. One area where the cool-down is notable is in the strength of offers that sellers accept on a monthly basis. Although sellers received on average 100.9 percent of their list price for the year, they accepted 96.3 percent in December. That’s the lowest figure since December 2016.

“I went from sifting through more than 10 offers with my sellers to counseling them about being patient while on the market all within one year’s time,” said Jerry Moscowitz, President of Minneapolis Area REALTORS®. “Inflation may be turning a corner and rates could moderate by summer. If that happens, pent-up demand will surface and we’ll go right back to a competitive market with bidding wars where demand far exceeds supply.”

The ongoing supply-demand imbalance combined with rising rates and rising prices has truly exacerbated affordability concerns pricing too many out of the marketplace. The Housing Affordability Index reached its lowest level since at least 2004. But the Twin Cities is still better than most comparable metros. Currently, the regional median income is 95.0 percent of the necessary income needed to qualify for the median-priced home at today’s interest rates while avoiding becoming cost-burdened, which is typically defined as spending 30.0 percent or less of one’s pre-tax income on housing costs.

Overall, since both buyer and seller activity came down in tandem, the balance of market activity has remained relatively tight. Rising supply combined with falling demand can sometimes result in prices softening. But at $362,500, the median home price is still rising, albeit at a slower pace. New homes tended to outperform along with the over $1M luxury segment which even saw an increase in sales compared to last year. Although condo sales declined with the rest of the market, market times were flat while sellers accepted stronger offers.

While it was a year of fluctuations, tens of thousands of Minnesotans were able to get their housing goals met. As inflation cools the rate environment could ease. That could incentivize more demand that would still be faced with a shortage of supply. Housing supply is structural; housing demand is cyclical.
For other year-end residential real estate information and for stand-alone December 2022 data, please visit www.mplsrealtor.com and www.spaar.com.

2022 BY THE NUMBERS | COMPARED TO 2021

  • Sellers listed 68,006 properties on the market, a 10.0 percent decrease from 2021
  • Buyers closed on 53,714 properties, down 19.1 percent
  • The Median Sales Price rose 6.6 percent to $362,500
  • Inventory levels rose 16.2 percent to 5,914 units as of year-end
  • Months Supply of Inventory was up 47.1 percent to 1.4 months of supply (5-6 months is balanced)
  • Days on Market increased 10.7 percent to 31 days, on average (median of 14, up 27.3 percent)
  • Changes in Sales activity varied by market segment
    • Single family sales were down 19.2 percent; condo sales fell 20.3 percent; townhome sales decreased 17.8 percent
    • Traditional sales fell 19.2 percent; foreclosure sales rose 1.5 percent; short sales were up 6.7 percent
    • Previously owned sales decreased 20.1 percent; new construction sales fell 8.3 percent
    • $1M+ luxury sales grew 7.5 percent to a record high

From The Skinny Blog.

Weekly Market Report

For Week Ending January 7, 2023

Fannie Mae recently announced changes to its automated underwriting system intended to simplify the loan process and help create more homeownership opportunities for underserved borrowers lacking an established credit history. The changes include updating eligibility criteria for loans where borrowers do not have a credit score, using borrowers’ bank statements to determine cash flow and balance trends, and providing an automated option for lenders to document nontraditional credit sources.

IN THE TWIN CITIES REGION, FOR THE WEEK ENDING JANUARY 7:

  • New Listings decreased 5.3% to 808
  • Pending Sales decreased 30.5% to 386
  • Inventory increased 18.4% to 5,999

FOR THE MONTH OF NOVEMBER:

  • Median Sales Price increased 4.4% to $354,900
  • Days on Market increased 33.3% to 40
  • Percent of Original List Price Received decreased 2.6% to 97.2%
  • Months Supply of Homes For Sale increased 50.0% to 1.8

All comparisons are to 2022

Click here for the full Weekly Market Activity Report. From MAAR Market Data News.

Mortgage Rates Decline

January 12, 2023
While mortgage rates have resumed their decline, the market remains hypersensitive to rate movements, with purchase demand experiencing large swings relative to small changes in rates. Over the last few weeks latent demand has been on display with buyers jumping in and out of the market as rates move.

Information provided by Freddie Mac.