Lauren Novak

612.805.5718

Lauren@laurennovak.com

Despite pandemic, this year is on-track for record-breaking sales

New listings flat, sales up, price growth strong, market times fast, but supply levels extremely low

(December 17, 2020) – According to new data from the Minneapolis Area REALTORS® and the Saint Paul Area Association of REALTORS®, the growth in buyer and seller activity in the 16-county Twin Cities metro continues to climb above 2019 levels. Seller activity rose 1.3 percent from last November while new purchase agreements were up 13.4 percent over last year. That marks the strongest November pending sales figure since 2004 and the highest closed sales since at least 2003.


This year, the fall and winter markets are behaving more like a spring market since activity was delayed from the spring and summer months. While sellers only listed slightly more units than last November, pending and closed sales were up significantly. Pending sales often act as a leading indicator of future demand while closings lag.“The Twin Cities housing market continues to exceed expectations,” according to Patrick Ruble, President of the Saint Paul Area Association of REALTORS®. “Despite record sales figures, the lack of adequate supply—particularly affordable units—continues to frustrate buyers.”

Historically low mortgage rates, shifting work and learning patterns, health concerns and other factors are driving this sellers’ market. While all areas and price points are unique, sellers are getting strong offers early on. On average, sellers obtained 100.2 percent of their original list price—the highest November figure since at least 2003. At a median of 15 days, homes went under contract in record time, and 48.3 percent faster than last November.

“It’s truly impressive that sales would reach new highs during a pandemic and an otherwise challenging year,” said Linda Rogers, President of Minneapolis Area REALTORS®. “That’s of course meant rising home prices, but luckily, ultra-low interest rates have been able to partly offset that.”

Sales were up 21.5 percent in Minneapolis and 30.8 percent in St. Paul, suggesting buyers are eager to quickly snap up any new listings. And the competitive landscape means those buyers are often going above list price. With prices slightly lower, market times higher and offers weaker, the condo market continues to lag other segments. However, sales of luxury properties ($1M+) have been soaring higher—up nearly 20.0 percent YTD. One thing is clear: the housing market continues to outperform, despite the many economic headwinds.

November 2020 by the numbers compared to a year ago

  • Sellers listed 4,035 properties on the market, a 1.3 percent increase from last November
  • Buyers signed 4,640 purchase agreements, up 13.4 percent (5,624 closed sales, up 18.6 percent)
  • Inventory levels fell 37.9 percent to 6,642 units
  • Months Supply of Inventory was down 42.9 percent to2 months (5-6 months is balanced)
  • The Median Sales Price rose 10.7 percent to $310,000
  • Days on Market decreased 33.3 percent to 34 days, on average (median of 15, down 48.3 percent)
  • Changes in Sales activity varied by market segment
    • Single family sales were up 21.3 percent; condo sales fell 2.6 percent; townhome sales increased 20.6 percent
    • Traditional sales rose 19.7 percent; foreclosure sales were down 22.9 percent; short sales fell 18.8 percent
    • Previously owned sales were up 21.7 percent; new construction sales climbed 4.8 percent

From The Skinny Blog.

Mortgage Rates Hit Another Record Low

December 17, 2020
The housing market continues to surge higher and support an otherwise stagnant economy that has lost momentum in the last couple of months. Mortgage rates are at record lows and pushing many prospective homebuyers off the sidelines and into the market. Homebuyer sentiment is sanguine and purchase demand shows no real signs of waning at all heading into next year.

Information provided by Freddie Mac.

Weekly Market Report

For Week Ending December 5, 2020

The National Association of REALTORS® released a new report analyzing relocation trends during the pandemic. From March through October 2020, 8.9 million people moved according to the NAR’s analysis of USPS change-of-address data. While this sounds substantial, when comparing to the same period last year, only approximately 94,000 more people moved this year than a year ago. The biggest trend was people moving from large cities to surrounding suburbs, with those counties located closest to big cities seeing the highest relocation gains.

In the Twin Cities region, for the week ending December 5:

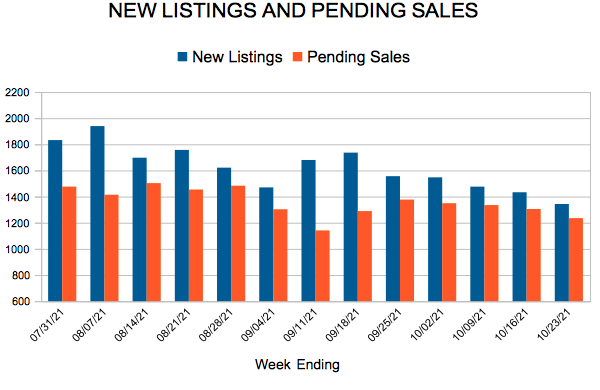
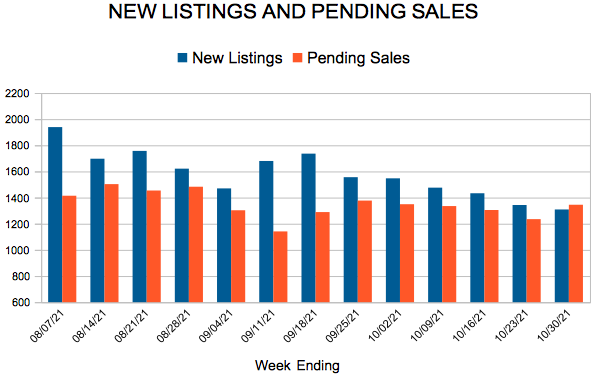
  • New Listings decreased 2.9% to 851
  • Pending Sales increased 7.1% to 999
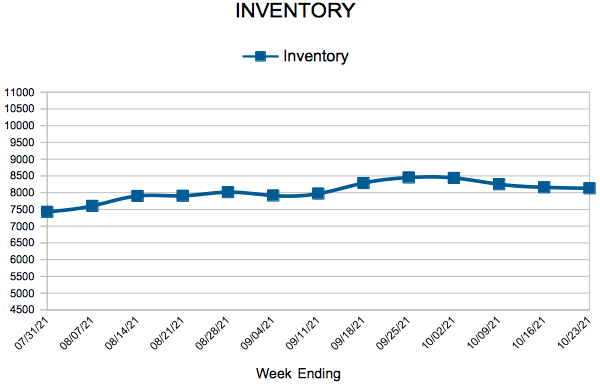
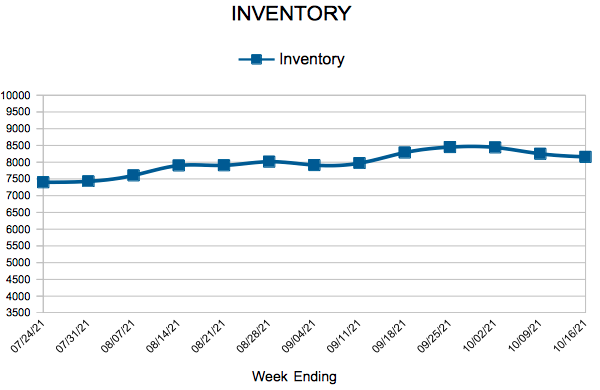
  • Inventory decreased 35.3% to 6,748

For the month of October:

  • Median Sales Price increased 12.5% to $315,000
  • Days on Market decreased 23.9% to 35
  • Percent of Original List Price Received increased 2.4% to 100.5%
  • Months Supply of Homes For Sale decreased 36.0% to 1.6

All comparisons are to 2019

Click here for the full Weekly Market Activity Report. From MAAR Market Data News.

Weekly Market Report

For Week Ending July 27, 2019

As we await July results, the June numbers and preliminary July indicators suggest that current trends in most real estate markets are likely to continue. Mid-to-lower priced segments continue to experience imbalances favoring sellers, leading to steady year-over-year increases in price, outpacing inflation in many markets. Although the Fed rate decrease dominated the news this week, industry experts seem to agree this event by itself is unlikely to have much effect on mortgage rates and real estate markets, at least in the short term.

In the Twin Cities region, for the week ending July 27:

  • New Listings decreased 4.7% to 1,736
  • Pending Sales decreased 4.9% to 1,364
  • Inventory decreased 3.0% to 12,236

For the month of June:

  • Median Sales Price increased 7.2% to $290,000
  • Days on Market increased 2.5% to 41
  • Percent of Original List Price Received decreased 0.3% to 100.0%
  • Months Supply of Homes For Sale increased 4.0% to 2.6

All comparisons are to 2018

Click here for the full Weekly Market Activity Report. From MAAR Market Data News.
Test Post

What is Lorem Ipsum?

Lorem Ipsum is simply dummy text of the printing and typesetting industry. Lorem Ipsum has been the industry’s standard dummy text ever since the 1500s, when an unknown printer took a galley of type and scrambled it to make a type specimen book. It has survived not only five centuries, but also the leap into electronic typesetting, remaining essentially unchanged. It was popularised in the 1960s with the release of Letraset sheets containing Lorem Ipsum passages, and more recently with desktop publishing software like Aldus PageMaker including versions of Lorem Ipsum.

Why do we use it?

It is a long established fact that a reader will be distracted by the readable content of a page when looking at its layout. The point of using Lorem Ipsum is that it has a more-or-less normal distribution of letters, as opposed to using ‘Content here, content here’, making it look like readable English. Many desktop publishing packages and web page editors now use Lorem Ipsum as their default model text, and a search for ‘lorem ipsum’ will uncover many web sites still in their infancy. Various versions have evolved over the years, sometimes by accident, sometimes on purpose (injected humour and the like).


Where does it come from?

Contrary to popular belief, Lorem Ipsum is not simply random text. It has roots in a piece of classical Latin literature from 45 BC, making it over 2000 years old. Richard McClintock, a Latin professor at Hampden-Sydney College in Virginia, looked up one of the more obscure Latin words, consectetur, from a Lorem Ipsum passage, and going through the cites of the word in classical literature, discovered the undoubtable source. Lorem Ipsum comes from sections 1.10.32 and 1.10.33 of “de Finibus Bonorum et Malorum” (The Extremes of Good and Evil) by Cicero, written in 45 BC. This book is a treatise on the theory of ethics, very popular during the Renaissance. The first line of Lorem Ipsum, “Lorem ipsum dolor sit amet..”, comes from a line in section 1.10.32.

The standard chunk of Lorem Ipsum used since the 1500s is reproduced below for those interested. Sections 1.10.32 and 1.10.33 from “de Finibus Bonorum et Malorum” by Cicero are also reproduced in their exact original form, accompanied by English versions from the 1914 translation by H. Rackham.

Where can I get some?

There are many variations of passages of Lorem Ipsum available, but the majority have suffered alteration in some form, by injected humour, or randomised words which don’t look even slightly believable. If you are going to use a passage of Lorem Ipsum, you need to be sure there isn’t anything embarrassing hidden in the middle of text. All the Lorem Ipsum generators on the Internet tend to repeat predefined chunks as necessary, making this the first true generator on the Internet. It uses a dictionary of over 200 Latin words, combined with a handful of model sentence structures, to generate Lorem Ipsum which looks reasonable. The generated Lorem Ipsum is therefore always free from repetition, injected humour, or non-characteristic words etc.

  • There are many variations of passages of Lorem Ipsum available
  • There are many variations of passages of Lorem Ipsum available
  • There are many variations of passages of Lorem Ipsum available
  • There are many variations of passages of Lorem Ipsum available
  • There are many variations of passages of Lorem Ipsum available
  • There are many variations of passages of Lorem Ipsum available

There are many variations of passages of Lorem Ipsum

There are many variations of passages of Lorem Ipsum

There are many variations of passages of Lorem Ipsum

There are many variations of passages of Lorem Ipsum

There are many variations of passages of Lorem Ipsum

There are many variations of passages of Lorem Ipsum

There are many variations of passages of Lorem Ipsum