 For Week Ending April 24, 2021
A bit of good news this week on the home affordability front as the 30-year fixed-rate mortgage slipped below 3 percent to 2.97%, according to Freddie Mac. The benchmark 30-year fixed-rate mortgage rate, while still higher than a few months ago, remains more than one third of a percent less than the same time last year. The slight pullback in rates may be short lived, however, as Nadia Evangelou, senior economist for the National Association of REALTORS®, still expects rates to rise in the coming months.
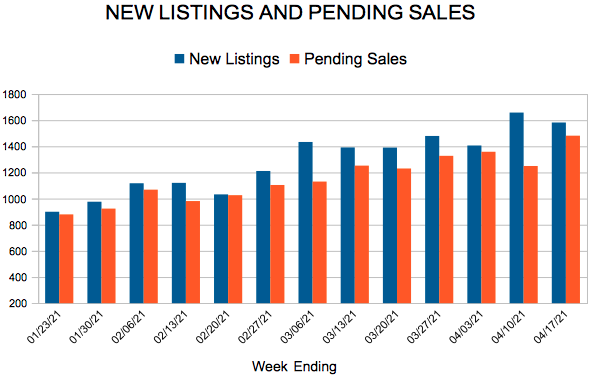
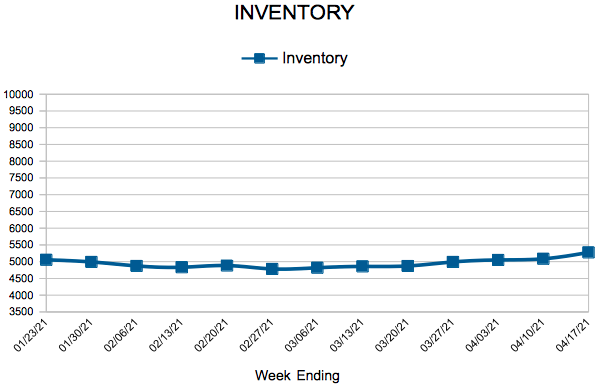
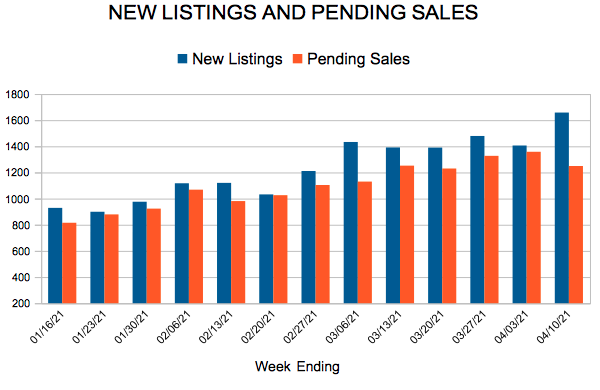
In the Twin Cities region, for the week ending April 24:
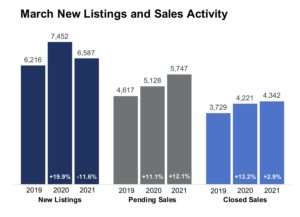
- New Listings increased 14.5% to 1,687
- Pending Sales increased 38.4% to 1,509
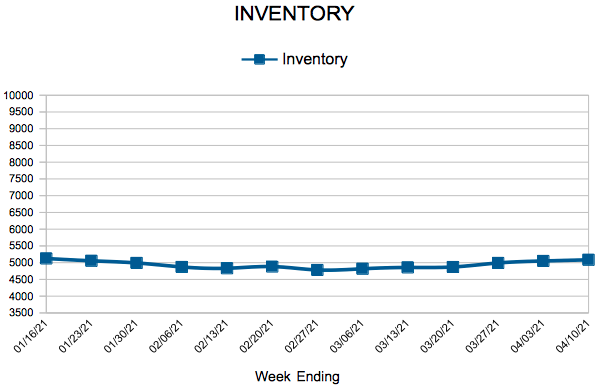
- Inventory decreased 47.5% to 5,337
For the month of March:
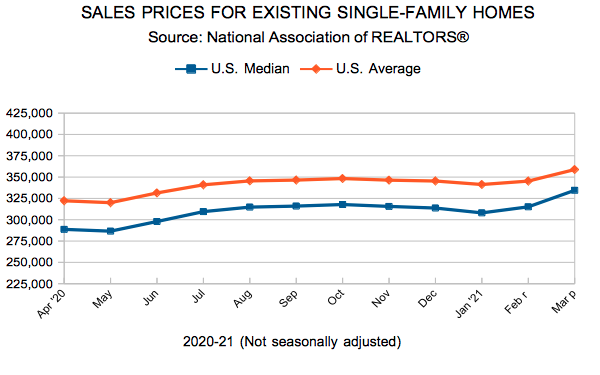
- Median Sales Price increased 10.4% to $328,000
- Days on Market decreased 36.1% to 39
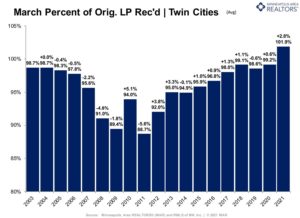
- Percent of Original List Price Received increased 2.7% to 101.9%
- Months Supply of Homes For Sale decreased 47.4% to 1.0
All comparisons are to 2020
Click here for the full Weekly Market Activity Report. From MAAR Market Data News.